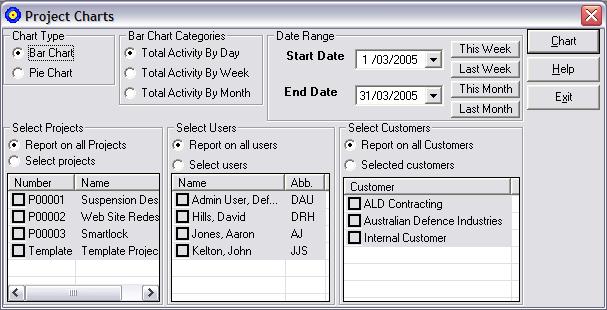
Project Charts in Timesheets MTS |
Timesheets MTS provides powerful project activity charting abilities using Microsoft Excel. Just click the Project Charts menu option on on the Tools menu.
You can generate aproject by selecting the range of dates you want to report on (enter a date in to the Start Date and End fields), selecting how you would like the times sub-totalled (by day, week, or month), selecting the projects you want to report on (all or a selection) and clicking the Chart button. This will produce an Excel graph showing the total time spent on each selected project during your selected time period.
Example Excel Project Chart
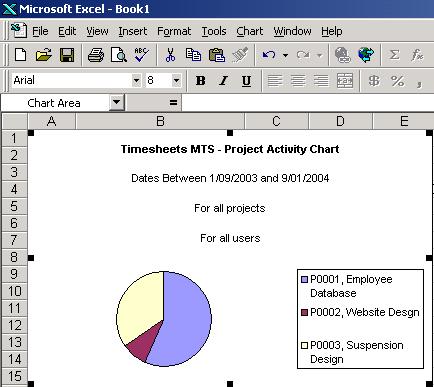
This chart can be used by project managers to monitor budgets, rate of spend, and project progress.